An Asset-Mapping Success Story: DC Kids Count Data Tools 2.0

http://datatools.dcactionforchildren.org/
An exceptional example of mapping neighborhood-level data is the collaborative effort from DC Action for Children and DataKind.
DC Action for Children is part of the Annie E. Casey Foundation’s KIDS COUNT network of 53 child advocacy organizations charged with tracking child well-being data. When DC Action for Children were given a planning year to experiment, they partnered with DataKind! DC Action for Children wanted to build their capacity and embark on the journey of a new movement towards data-visualizations and open data.
In search of a new data partner, DC Action looked for both traditional and non-traditional partners and selected by DataKind as one of their 3 non-profits in a competitive data-dive to hook up socially entrepreneurial non-profits with data-scientists. After a 36 hour weekend long data-dive emerged a long-term partnership with a team of volunteers through DataKind, an organization that uses a collaborative approach for greater understanding and positive social action/ change through data.
The product of this working relationship is a series of interactive maps, updated to version 2.0 in July 2014, that show visual representations of child health and well-being in the Washington, DC on factors of child well-being such as: number of children enrolled in Medicaid, child poverty rate, existence of public and charter schools, youth employment rate, number of rail stations and bus stops, and occurrence of violent crime. It was the very first time an analysis was taken to the neighborhood cluster level vs. the ward level.
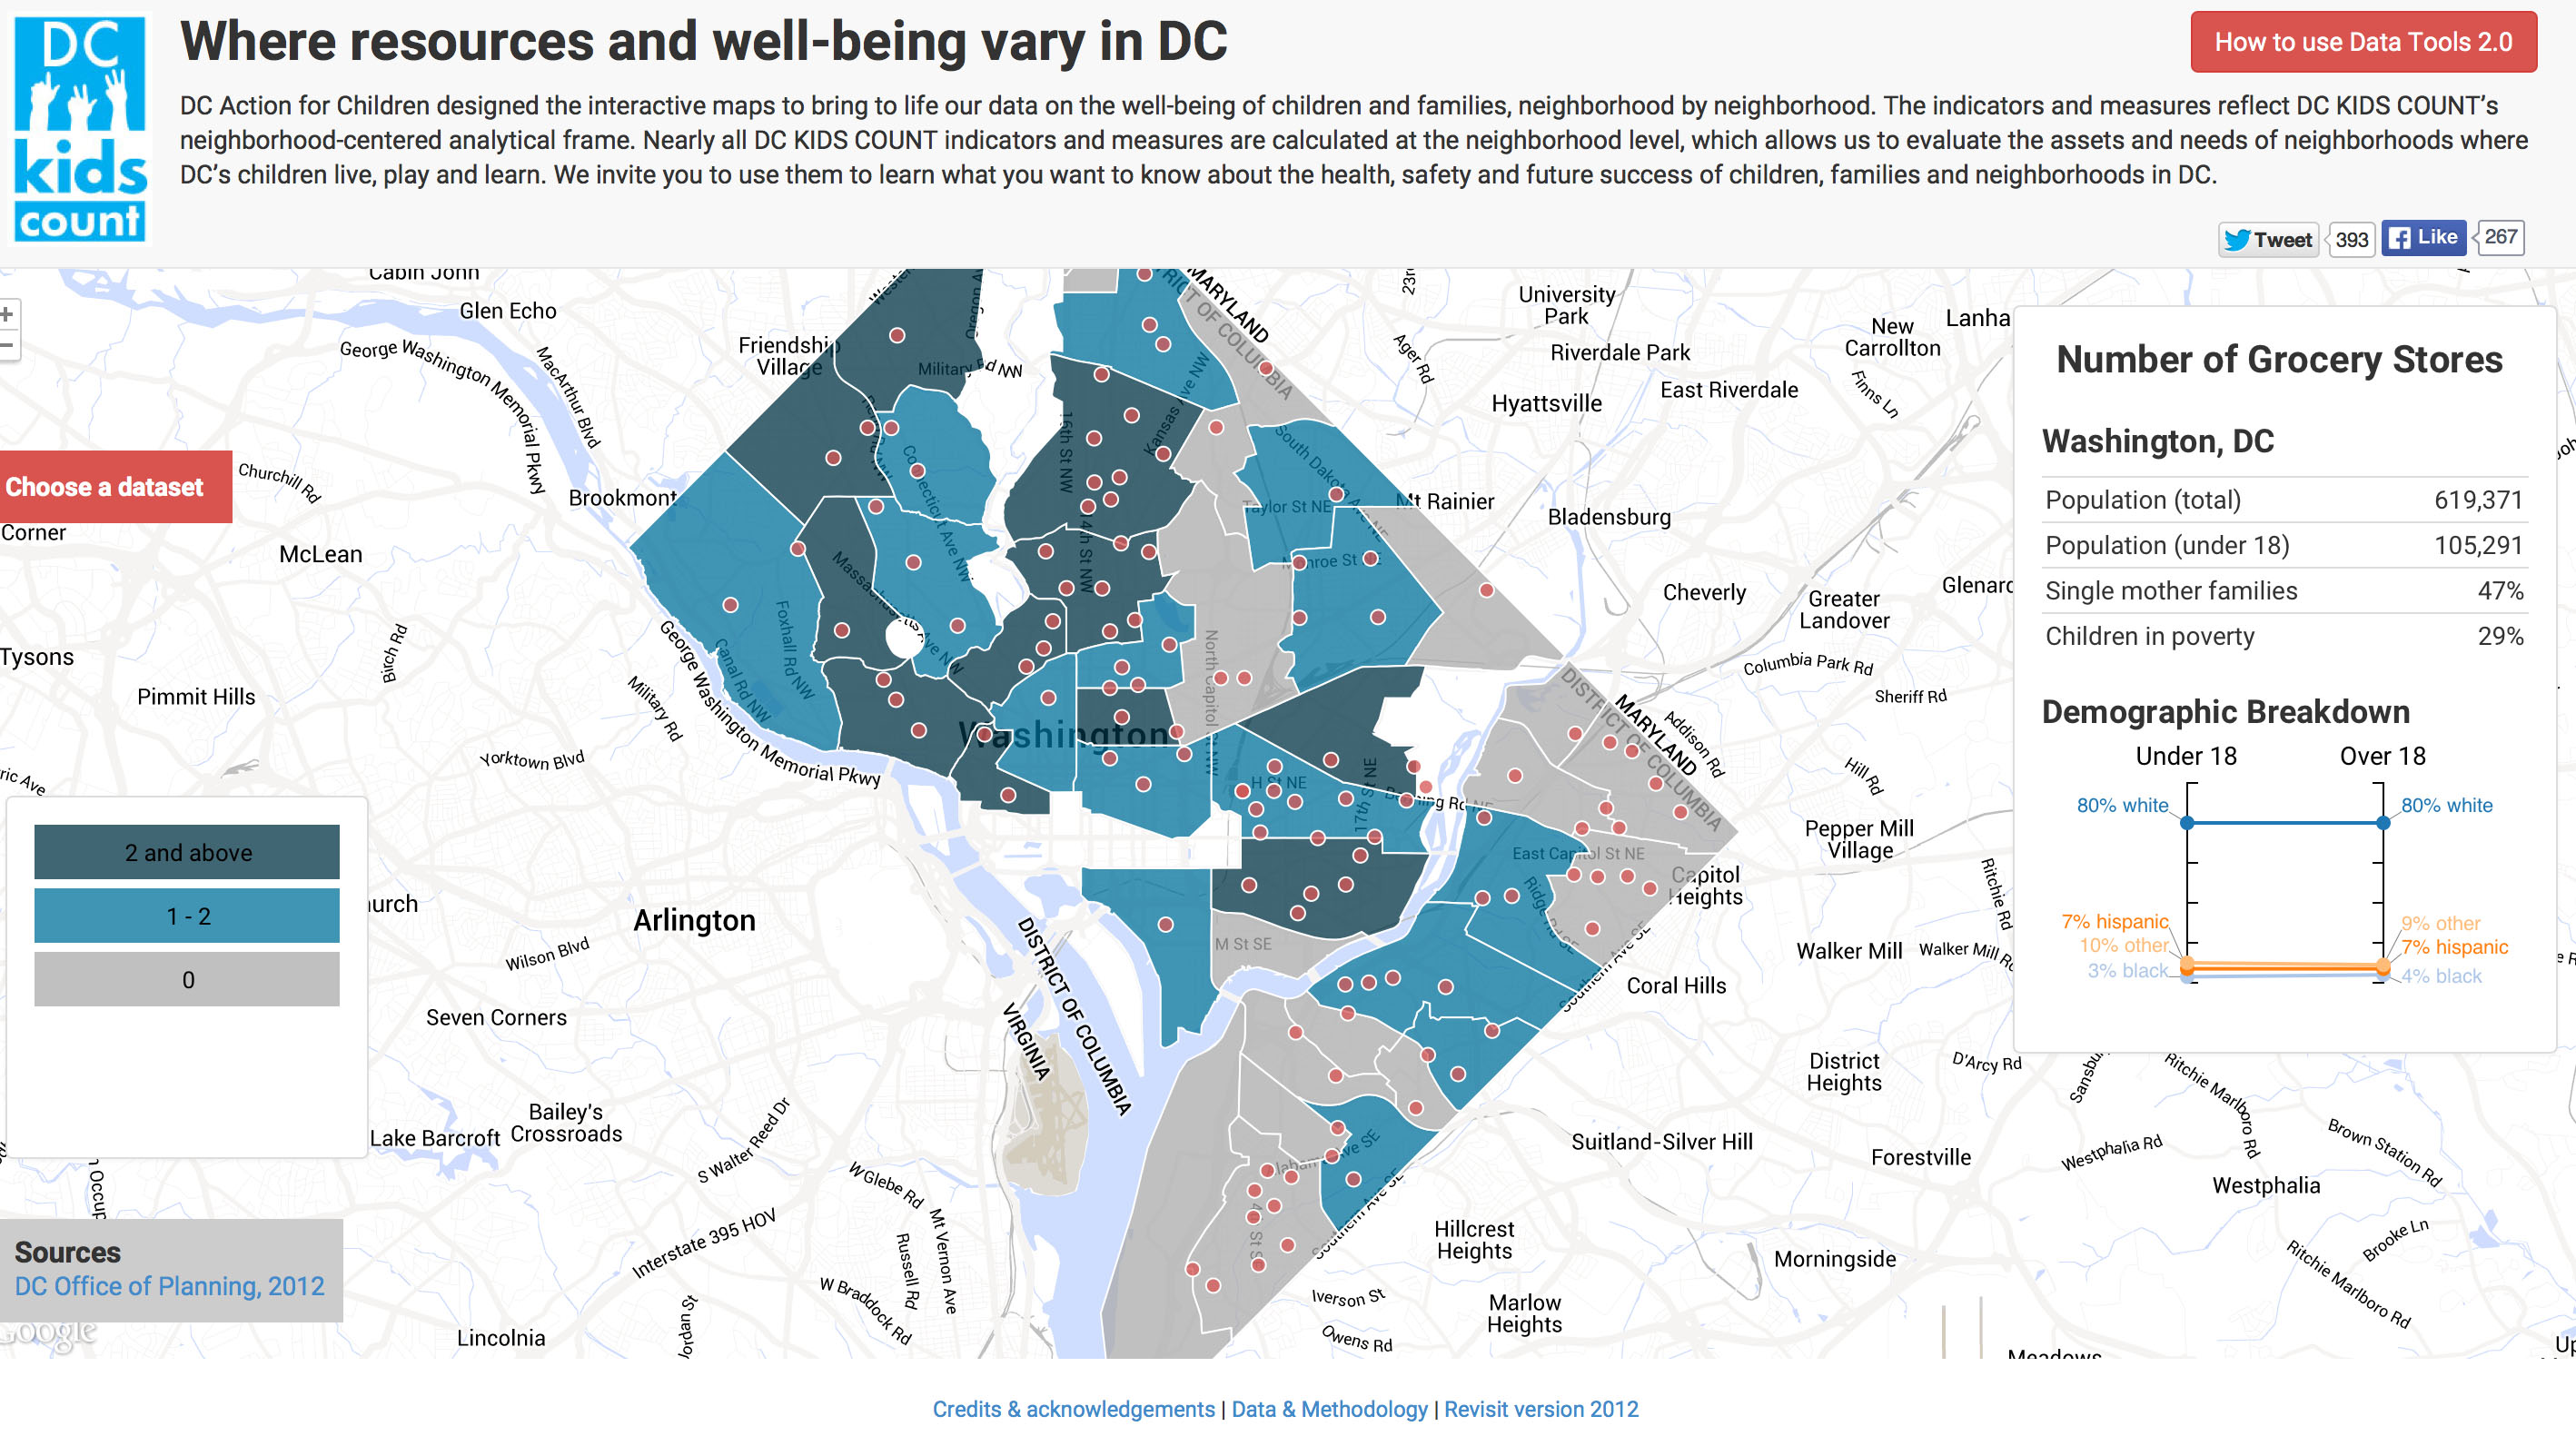
The maps also provide guidance to inform how programs and policies can better serve children and youth living in the capitol’s most underserved areas. It is a visual reminder for policy makers that neighborhood assets don’t align with needs of our most vulnerable children. Through the use of the maps, we are able to show where children with most “need” of mental health services and the mis-match of where providers are located. In this scenario, it was NOT about additional funds but rather aligning the needs of additional mental health services to where children live.
http://www.edcentral.org/beautiful-day-neighborhood-picturing-poverty-effects/
More information:
Data Tools 2.0 Methodology
http://www.dcactionforchildren.org/dc-kids-count-data-tools-methodology
http://dcist.com/2014/05/four_maps_that_show_how_children_li.php
http://www.datakind.org/blog/dc-action-for-children-long-term-collaboration-for-long-term-impact/
Click here to download the file